Violent crime
1,281 per 100,000 residents, per year
431 reported in the last 12 months
−49% vs. Chicago (2,494)
Data through September 2026, Chicago Police Department
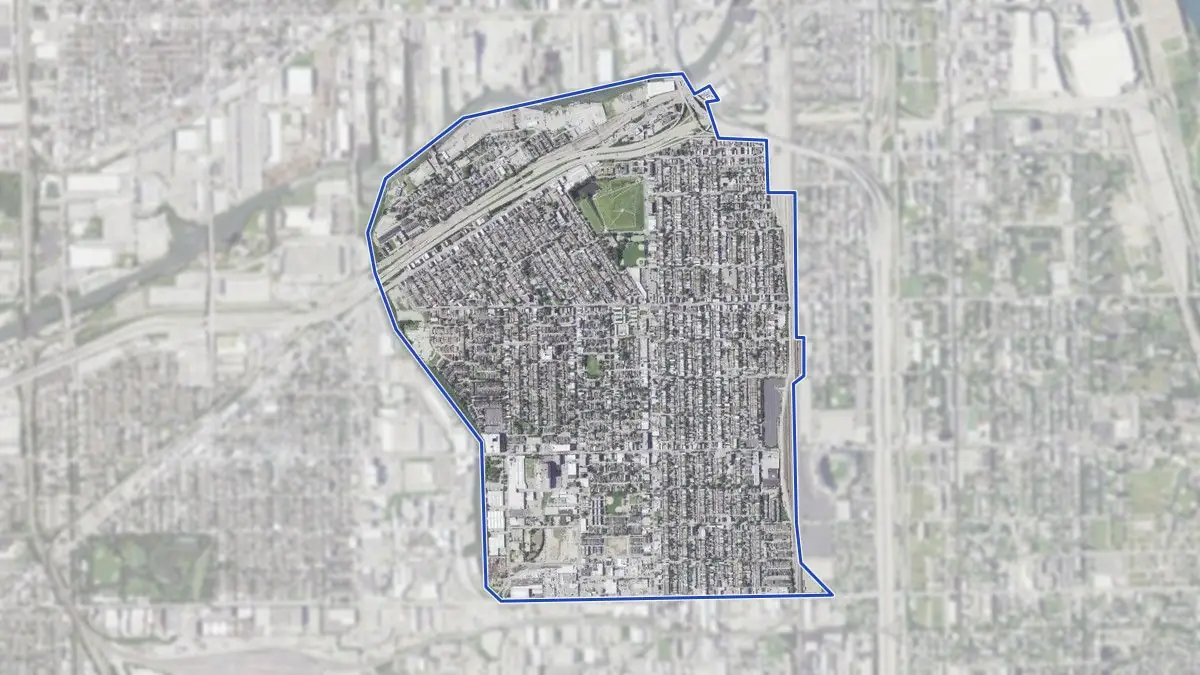
The violent crime rate in Bridgeport is 1,281 per 100,000 residents per year, 49% below Chicago as a whole (2,494). It ranks 57 of 75 community areas, where 1 is the highest rate.
Violent crime
1,281 per 100,000 residents, per year
431 reported in the last 12 months
−49% vs. Chicago (2,494)
Property crime
2,485 per 100,000 residents, per year
836 reported in the last 12 months
−37% vs. Chicago (3,944)
All reported
3,850 per 100,000 residents, per year
1,295 reported in the last 12 months
−44% vs. Chicago (6,855)
Rates use the 2020 Census population of 33,638 for Bridgeport. Small areas swing more month to month, so all rates here use a 12-month window ending September 2026.
1the block with the most violent incidents10the tenthCounted over the last 12 months. Point at a mark, or at a row in the table below, to see which street it is.
SaferHigher rateNot rated: park or fewer than 2,500 residentsArea shading: violent crimes per 100,000 residents per year, so you can see how this neighbourhood compares with the ones around it.
Bridgeport is in the middle of the city’s range: rank 57 of 75. Nearby in the ranking: Edgewater (1,370), Avondale (1,289), Logan Square (1,253), West Ridge (1,244).
| Block | Violent | Property | Share of area’s violent |
|---|---|---|---|
| 01030XX S Halsted St | 21 | 27 | 5% |
| 02031XX S Green St | 13 | 4 | 3% |
| 03024XX S Halsted St | 13 | 3 | 3% |
| 04031XX S Halsted St | 12 | 6 | 3% |
| 05024XX S Archer Ave | 11 | 19 | 3% |
| 06025XX S Archer Ave | 10 | 4 | 2% |
| 07034XX S Halsted St | 9 | 26 | 2% |
| 08007XX W 31st St | 9 | 8 | 2% |
| 09031XX S Lituanica Ave | 7 | 9 | 2% |
| 10032XX S Morgan St | 7 | 9 | 2% |
“Block” is the hundred-block as the police department publishes it (for example 51XX W Madison St), never an exact address. Only blocks with 5 or more violent incidents in the window are listed; the top 10 account for 26% of Bridgeport’s violent incidents. These are the numbered marks on the map above; hover a row to find it.
| Month | Violent crimes in Bridgeport |
|---|---|
| Oct 2025 | 47 |
| Nov 2025 | 32 |
| Dec 2025 | 21 |
| Jan 2026 | 31 |
| Feb 2026 | 24 |
| Mar 2026 | 34 |
| Apr 2026 | 30 |
| May 2026 | 46 |
| Jun 2026 | 41 |
| Jul 2026 | 43 |
| Aug 2026 | 38 |
| Sep 2026 | 44 |
In the last 12 months, half of the violent crime reported in Bridgeport happened between noon and 10 pm. No day of the week stood out.
Violent crime busiest hour 5 pm
Property crime busiest hour 10 pm
Each line is an average day of that kind, as a multiple of the average hour of the week (dashed line), smoothed over three hours. Days run from 6 am to 6 am, so a Friday night stays on Friday. Times are when the incident happened, as recorded by Chicago Police Department; 2% of incidents have no usable time (many unknown times are recorded as midnight or noon) and are left out.
| Hour | Friday and Saturday | Sunday to Thursday | All days |
|---|---|---|---|
| 6 am | 3 | 2 | 5 |
| 7 am | 6 | 12 | 18 |
| 8 am | 3 | 14 | 17 |
| 9 am | 7 | 12 | 19 |
| 10 am | 10 | 9 | 19 |
| 11 am | 4 | 11 | 15 |
| 12 pm | 5 | 15 | 20 |
| 1 pm | 4 | 12 | 16 |
| 2 pm | 4 | 16 | 20 |
| 3 pm | 5 | 22 | 27 |
| 4 pm | 5 | 16 | 21 |
| 5 pm | 7 | 21 | 28 |
| 6 pm | 4 | 17 | 21 |
| 7 pm | 6 | 17 | 23 |
| 8 pm | 6 | 19 | 25 |
| 9 pm | 7 | 18 | 25 |
| 10 pm | 6 | 8 | 14 |
| 11 pm | 6 | 10 | 16 |
| 12 am | 6 | 12 | 18 |
| 1 am | 4 | 8 | 12 |
| 2 am | 4 | 9 | 13 |
| 3 am | 4 | 7 | 11 |
| 4 am | 2 | 7 | 9 |
| 5 am | 3 | 11 | 14 |
| Total with a known time | 121 | 305 | 426 |
| Hour | Friday and Saturday | Sunday to Thursday | All days |
|---|---|---|---|
| 6 am | 7 | 21 | 28 |
| 7 am | 6 | 13 | 19 |
| 8 am | 6 | 17 | 23 |
| 9 am | 9 | 18 | 27 |
| 10 am | 13 | 16 | 29 |
| 11 am | 9 | 18 | 27 |
| 12 pm | 9 | 31 | 40 |
| 1 pm | 10 | 28 | 38 |
| 2 pm | 15 | 27 | 42 |
| 3 pm | 14 | 31 | 45 |
| 4 pm | 15 | 27 | 42 |
| 5 pm | 10 | 27 | 37 |
| 6 pm | 13 | 35 | 48 |
| 7 pm | 16 | 29 | 45 |
| 8 pm | 11 | 33 | 44 |
| 9 pm | 12 | 23 | 35 |
| 10 pm | 11 | 38 | 49 |
| 11 pm | 9 | 22 | 31 |
| 12 am | 10 | 14 | 24 |
| 1 am | 1 | 18 | 19 |
| 2 am | 11 | 18 | 29 |
| 3 am | 8 | 21 | 29 |
| 4 am | 8 | 19 | 27 |
| 5 am | 6 | 32 | 38 |
| Total with a known time | 239 | 576 | 815 |
| Offense | Reported | Per 100k, per year | vs. Chicago |
|---|---|---|---|
| Assault and batteryViolent | 407 | 1,210 | −47% |
| RobberyTaking property by force or threatViolent | 23 | 68 | −61% |
| HomicideViolent | 1 | 3.0 | −81% |
| TheftShoplifting, pickpocketing and other theft without force or entryProperty | 322 | 957 | −42% |
| Property damage and arsonProperty | 187 | 556 | −41% |
| Theft from vehiclesItems or parts taken from a vehicle, break-ins includedProperty | 137 | 407 | −17% |
| Vehicle theftProperty | 111 | 330 | −51% |
| BurglaryEntering a home or business to stealProperty | 79 | 235 | +11% |
| Drug offensesOther | 15 | 45 | −81% |
| Weapons offensesOther | 13 | 39 | −78% |