Violent crime
2,181 per 100,000 residents, per year
314 reported in the last 12 months
−13% vs. Chicago (2,494)
Data through September 2026, Chicago Police Department
The violent crime rate in O'Hare is 2,181 per 100,000 residents per year, 13% below Chicago as a whole (2,494). It ranks 35 of 75 community areas, where 1 is the highest rate.
Violent crime
2,181 per 100,000 residents, per year
314 reported in the last 12 months
−13% vs. Chicago (2,494)
Property crime
4,287 per 100,000 residents, per year
617 reported in the last 12 months
+9% vs. Chicago (3,944)
All reported
6,913 per 100,000 residents, per year
995 reported in the last 12 months
+1% vs. Chicago (6,855)
About 52,873 people work in O'Hare, 3.7 times its 14,394 residents (Census jobs data, 2023). The rates divide by residents only, so they run high here: most people in O'Hare on a weekday live somewhere else. The counts, and how they change from year to year, say more than the rate.
Rates use the 2020 Census population of 14,394 for O'Hare. Small areas swing more month to month, so all rates here use a 12-month window ending September 2026.
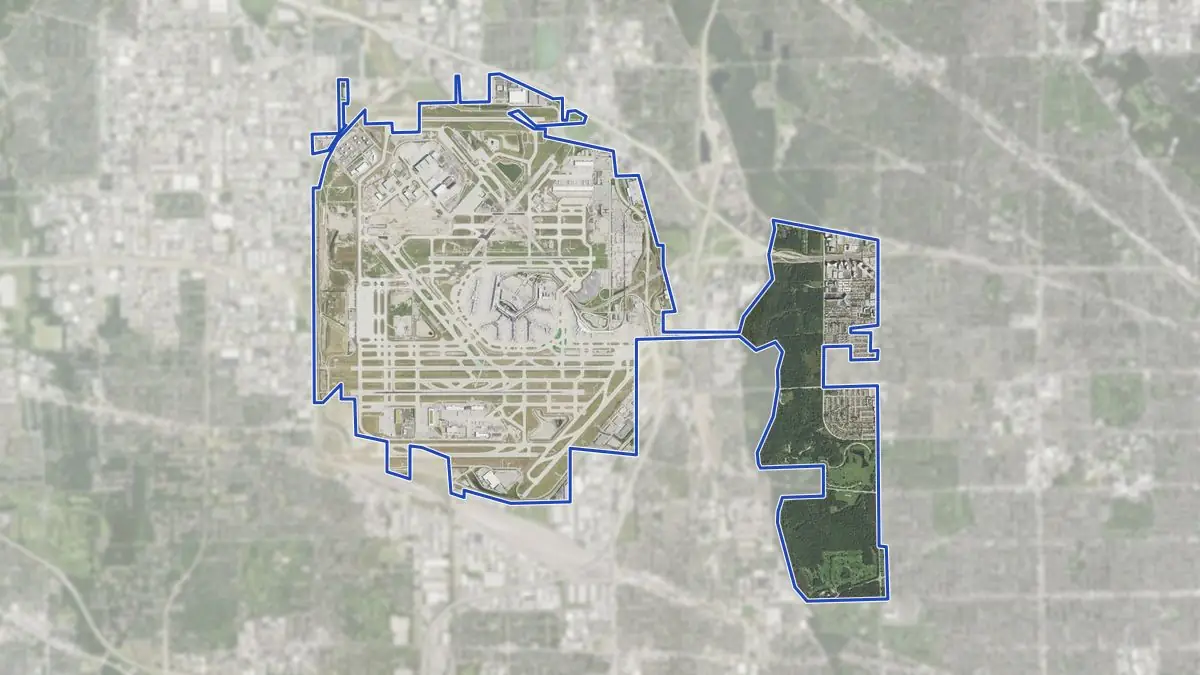
1the block with the most violent incidents10the tenthCounted over the last 12 months. Point at a mark, or at a row in the table below, to see which street it is.
SaferHigher rateNot rated: park or fewer than 2,500 residentsArea shading: violent crimes per 100,000 residents per year, so you can see how this neighbourhood compares with the ones around it.
O'Hare is in the middle of the city’s range: rank 35 of 75. Nearby in the ranking: Armour Square (2,420), Hegewisch (2,420), Rogers Park (2,123), Near North Side (2,105).
| Block | Violent | Property | Share of area’s violent |
|---|---|---|---|
| 010000X W Terminal St | 108 | 217 | 34% |
| 02100XX W Ohare St | 24 | 108 | 8% |
| 030000X W Cta Ohare Platform St | 19 | 7 | 6% |
| 04054XX N East River Rd | 18 | 25 | 6% |
| 05005XX W Ohare St | 13 | 11 | 4% |
| 06102XX W Zemke Rd | 8 | 26 | 3% |
| 07058XX N Cumberland Ave | 8 | 15 | 3% |
| 08053XX N Delphia Ave | 8 | 7 | 3% |
| 09086XX W Foster Ave | 6 | 3 | 2% |
“Block” is the hundred-block as the police department publishes it (for example 51XX W Madison St), never an exact address. Only blocks with 5 or more violent incidents in the window are listed; the top 9 account for 68% of O'Hare’s violent incidents. These are the numbered marks on the map above; hover a row to find it.
| Month | Violent crimes in O'Hare |
|---|---|
| Oct 2025 | 35 |
| Nov 2025 | 18 |
| Dec 2025 | 27 |
| Jan 2026 | 22 |
| Feb 2026 | 22 |
| Mar 2026 | 35 |
| Apr 2026 | 27 |
| May 2026 | 28 |
| Jun 2026 | 29 |
| Jul 2026 | 24 |
| Aug 2026 | 27 |
| Sep 2026 | 20 |
In the last 12 months, half of the violent crime reported in O'Hare happened between 2 pm and 11 pm. No day of the week stood out.
Violent crime busiest hour 5 pm
Property crime busiest hour 3 pm
Each line is an average day of that kind, as a multiple of the average hour of the week (dashed line), smoothed over three hours. Days run from 6 am to 6 am, so a Friday night stays on Friday. Times are when the incident happened, as recorded by Chicago Police Department; 3% of incidents have no usable time (many unknown times are recorded as midnight or noon) and are left out.
| Hour | Friday and Saturday | Sunday to Thursday | All days |
|---|---|---|---|
| 6 am | 2 | 5 | 7 |
| 7 am | 4 | 3 | 7 |
| 8 am | 7 | 10 | 17 |
| 9 am | 3 | 6 | 9 |
| 10 am | 4 | 6 | 10 |
| 11 am | 1 | 7 | 8 |
| 12 pm | 7 | 6 | 13 |
| 1 pm | 2 | 12 | 14 |
| 2 pm | 5 | 14 | 19 |
| 3 pm | 9 | 12 | 21 |
| 4 pm | 5 | 8 | 13 |
| 5 pm | 7 | 17 | 24 |
| 6 pm | 2 | 10 | 12 |
| 7 pm | 6 | 8 | 14 |
| 8 pm | 2 | 12 | 14 |
| 9 pm | 4 | 14 | 18 |
| 10 pm | 3 | 20 | 23 |
| 11 pm | 6 | 10 | 16 |
| 12 am | 4 | 7 | 11 |
| 1 am | 2 | 9 | 11 |
| 2 am | 4 | 5 | 9 |
| 3 am | 2 | 5 | 7 |
| 4 am | 2 | 4 | 6 |
| 5 am | 1 | 7 | 8 |
| Total with a known time | 94 | 217 | 311 |
| Hour | Friday and Saturday | Sunday to Thursday | All days |
|---|---|---|---|
| 6 am | 12 | 18 | 30 |
| 7 am | 3 | 15 | 18 |
| 8 am | 3 | 23 | 26 |
| 9 am | 9 | 19 | 28 |
| 10 am | 7 | 15 | 22 |
| 11 am | 9 | 14 | 23 |
| 12 pm | 15 | 16 | 31 |
| 1 pm | 7 | 31 | 38 |
| 2 pm | 12 | 21 | 33 |
| 3 pm | 7 | 38 | 45 |
| 4 pm | 4 | 21 | 25 |
| 5 pm | 13 | 19 | 32 |
| 6 pm | 14 | 28 | 42 |
| 7 pm | 4 | 24 | 28 |
| 8 pm | 6 | 22 | 28 |
| 9 pm | 3 | 14 | 17 |
| 10 pm | 10 | 18 | 28 |
| 11 pm | 4 | 17 | 21 |
| 12 am | 5 | 10 | 15 |
| 1 am | 2 | 7 | 9 |
| 2 am | 5 | 10 | 15 |
| 3 am | 3 | 8 | 11 |
| 4 am | 5 | 6 | 11 |
| 5 am | 2 | 20 | 22 |
| Total with a known time | 164 | 434 | 598 |
| Offense | Reported | Per 100k, per year | vs. Chicago |
|---|---|---|---|
| Assault and batteryViolent | 311 | 2,161 | −6% |
| RobberyTaking property by force or threatViolent | 3 | 21 | −88% |
| TheftShoplifting, pickpocketing and other theft without force or entryProperty | 398 | 2,765 | +69% |
| Property damage and arsonProperty | 96 | 667 | −29% |
| Vehicle theftProperty | 62 | 431 | −36% |
| Theft from vehiclesItems or parts taken from a vehicle, break-ins includedProperty | 44 | 306 | −37% |
| BurglaryEntering a home or business to stealProperty | 17 | 118 | −44% |
| Weapons offensesOther | 38 | 264 | +47% |
| Drug offensesOther | 26 | 181 | −24% |